This medical application was created for a concierge physician in New York City. He wanted a more sophisticated presentation for his high-end patients. He was dissatisfied with what was available from EMRs. So he began writing content about each test performed by his clinic, plus extensive introductions and other content. We started by generating a PDF that combined his text with patient results.
Together, we added many features that attempted to help patients own their health. For instance, my client would often get on his soapbox to complain about 'normal range' medicine... that is, having providers believe that any results within the 'normal' range (which means 95% of the population) don't need any kind of intervention. He believed strongly that you should proactively take steps (preferably starting with lifestyle changes) to mitigate or treat results that were borderline, or even on the low end of healthy. Despite this, he didn't have a solution. But I knew it bothered him.
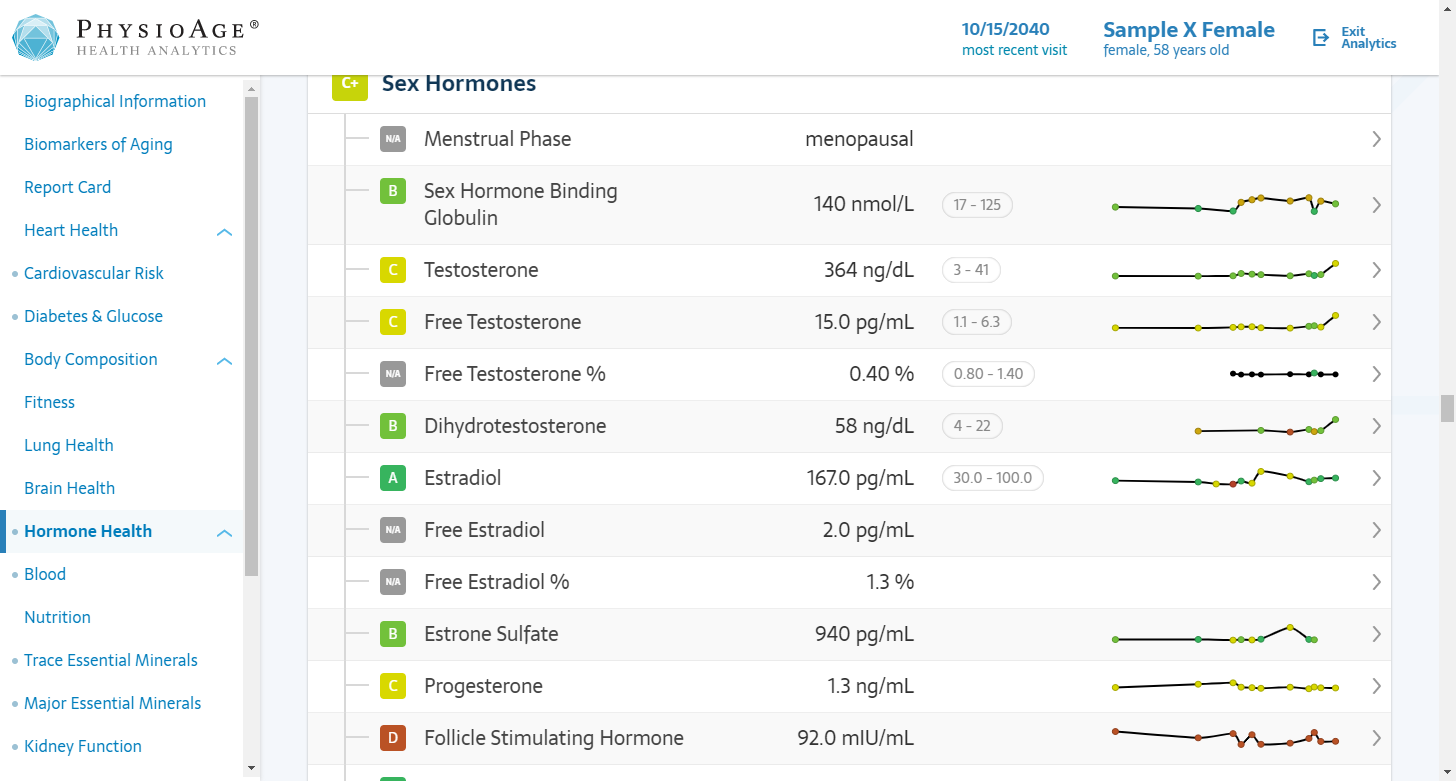
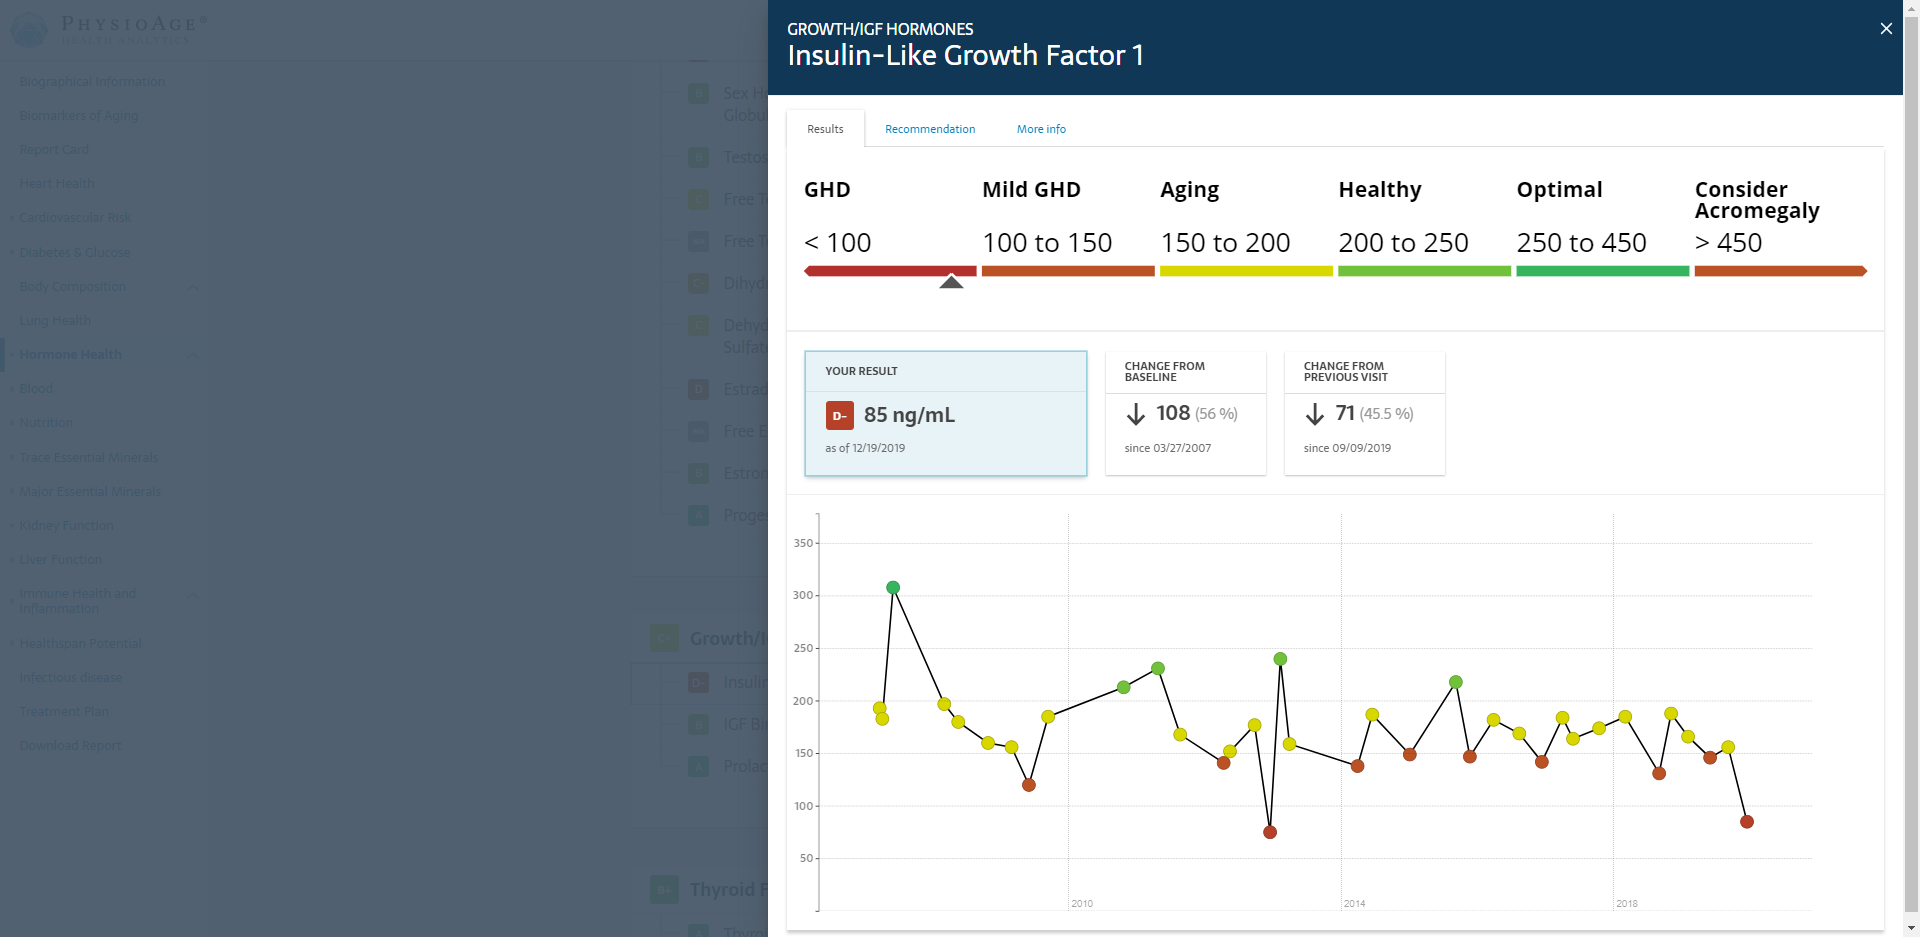
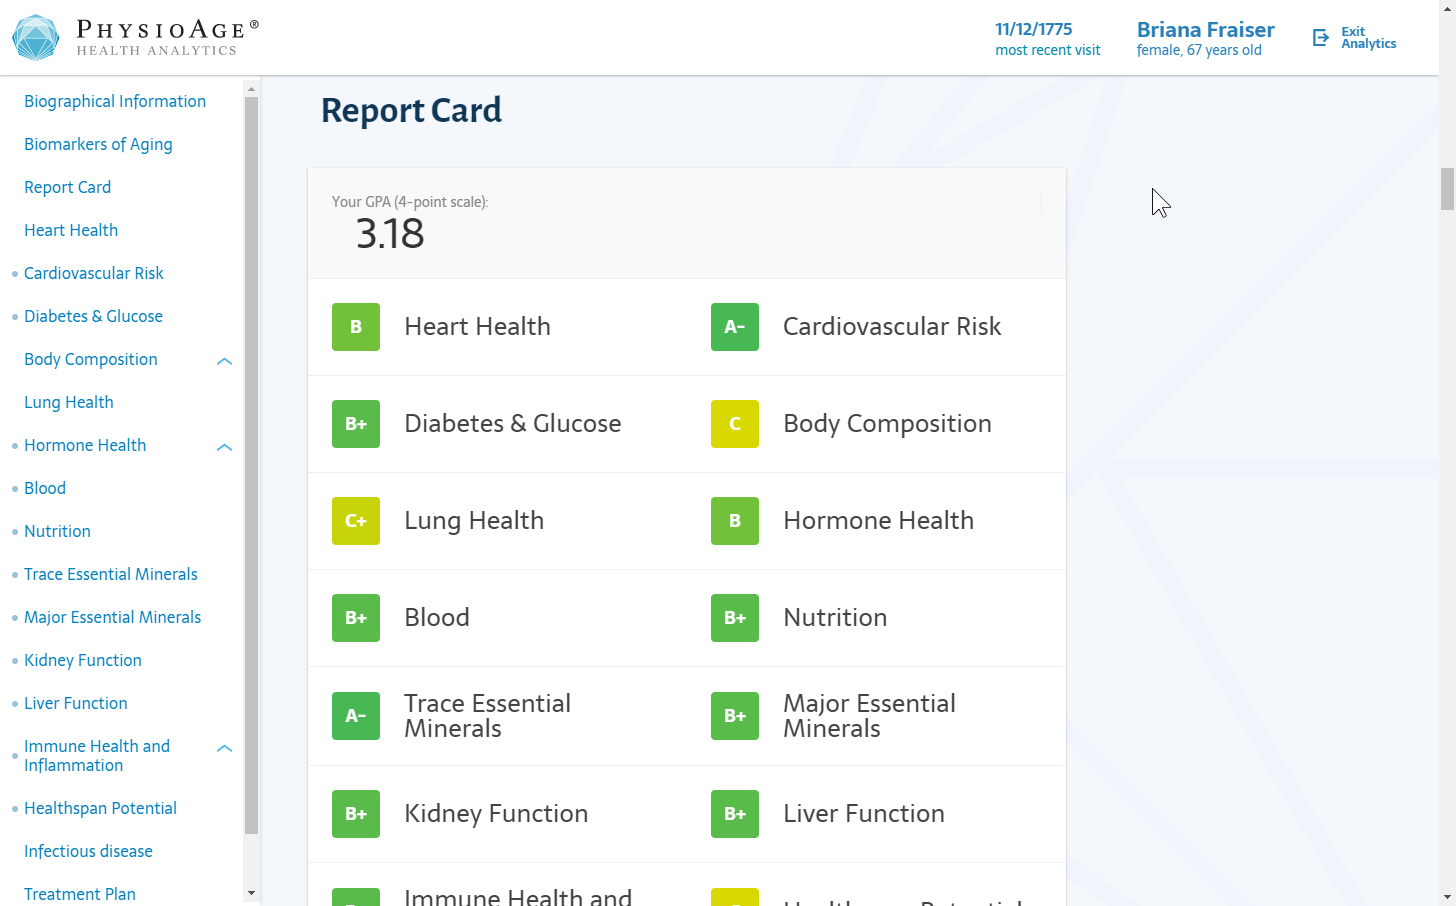
After thinking about his concerns, I was to take this criticism of the industry and to convince him to create more diagnostically useful ranges. Now instead of 'Norman' and 'Abnormal', we had Optimal, Healthy, Borderline, Disease and Critical. We used these to create 'spectrums' where patients could visually see where their values fell. We then turned those five ranges into letter grades, which in turn helped to generate a report card. Not many people know whether 5000 cells/µL is a good value for white blood cell count. But if I said you had an A, you'd be happy.
This app has collected hundreds of datapoints for thousands of patients and over 10,000 timepoints. Some of the data is used to do some predictive math about how patients are aging, which is then presented in a spectacular report.
I developed the technical architecture from concept to production, and went through several major versions. During this time, the software has transformed into an extensible, secure platform capable of delivering service to thousands of simultaneous users.
Over the years, I led product development efforts to add features that enriched the experience for both physicians and patients. In particular, I convinced my client to add a second kind of presentation (built on top of our existing data layer) which was more like powerpoint than a PDF report. It was an interactive dashboard that redefined how patients interact with their health data.
In order to manage all of the content used by our reports and our analytics platform, including spectrum values, references to medical literature, descriptions of tests, and much more, I built a custom content management system. I created an API between this lexicon and our reporting system. I integrated with medical laboratories like LabCorp and Quest to automate the process of ingesting sensitive health data into the platform. Throughout this process, I served not just as the developer but also the analyst who determined what to build to solve business problems, the architect who determined how to build it, and the CTO who determined how to deploy these solutions in real-world environments and maintain the operations of the platform.
In 2018, this company began a joint venture with a national pharmacy. We're transitioning development responsibilities to that team. I wish them well as my time with this team ends.
Johnathon has been a silent partner in our business for years. We highly recommend him.


